

How Much Do Blue Ridge Cabin Rentals Make?

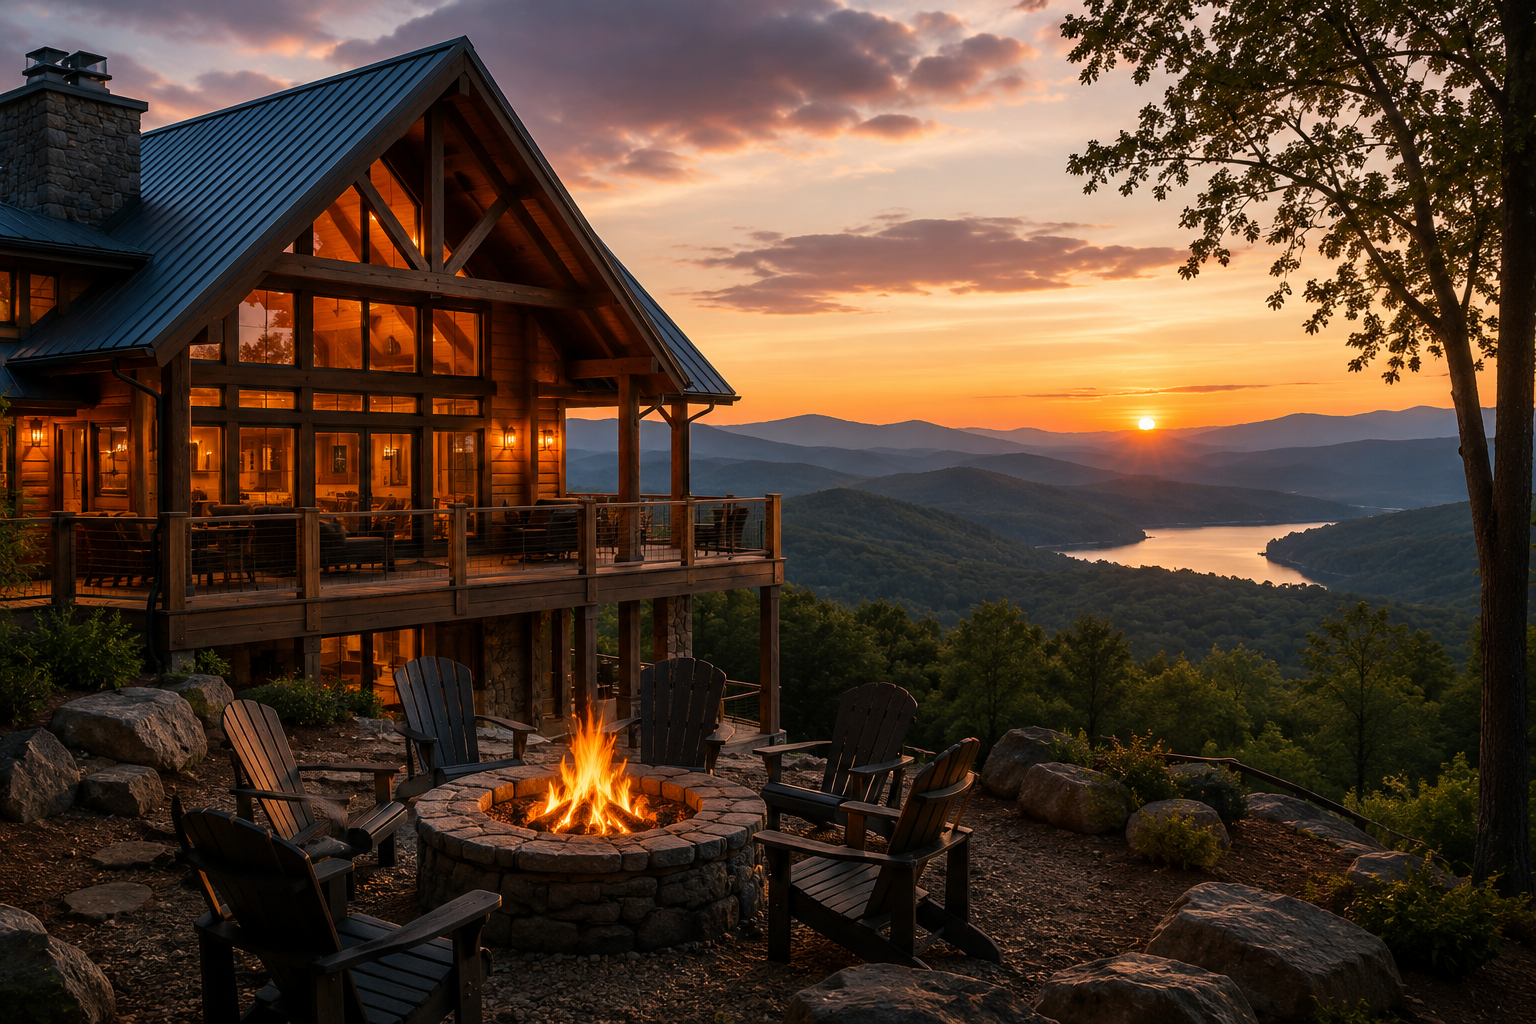
A Blue Ridge, GA cabin generates about $42,400 in average annual revenue according to AirDNA, while Rabbu reports a similar market average of about $41,400. Those averages give you a useful starting point, but larger cabins can earn considerably more. Current Rabbu data shows 5-bedroom properties averaging roughly $80,000 in annual gross rental revenue and 6+ bedroom properties averaging about $150,000.
That means the practical earning range changes considerably depending on the cabin you own. If you're evaluating a premium property or adding another Blue Ridge cabin to a portfolio, the question isn't simply whether Blue Ridge cabins make around $40,000 a year. You want to know where your type of cabin fits in the market and what could move it toward the higher end of its potential.
How Much Can Your Blue Ridge Cabin Make?
The size of the cabin gives us one of the clearest starting points. Rabbu's current Blue Ridge data shows annual revenue increasing substantially as properties move into the larger bedroom categories.
Average Annual Revenue by Cabin Size
| Cabin size | Average annual revenue | Average daily rate | Occupancy rate |
|---|---|---|---|
| 1 bedroom | $31,438 | $181 | 37% |
| 2 bedrooms | $30,338 | $182 | 32% |
| 3 bedrooms | $40,177 | $248 | 26% |
| 4 bedrooms | $56,598 | $346 | 28% |
| 5 bedrooms | $79,732 | $460 | 33% |
| 6+ bedrooms | $150,483 | $774 | 29% |
1- and 2-Bedroom Cabins Average Around $30,000
Smaller Blue Ridge cabins in Rabbu's dataset average roughly $30,000 to $31,000 in annual revenue. These properties tend to operate at lower nightly rates, with ADRs around $181 to $182, but their smaller footprint can also mean a very different acquisition price and operating cost structure from a large luxury cabin.
They also serve a different guest. A 1-bedroom mountain cabin built around a couple's getaway isn't trying to win the same reservation as a 6-bedroom property designed for several families traveling together. Both are Blue Ridge cabin rentals, but the economics of the stay are very different.
3- and 4-Bedroom Cabins Move Into the $40,000-$57,000 Range
Rabbu reports approximately $40,200 in average annual revenue for 3-bedroom properties and $56,600 for 4-bedroom properties. Average daily rates also increase from roughly $248 to $346.
This is where the details of the property begin to matter even more. Two 4-bedroom cabins can differ considerably in guest capacity, bathroom count, views, outdoor space, and amenities, so the bedroom average is best viewed as a starting point rather than a forecast for your particular property.
5- and 6+ Bedroom Cabins Can Reach $80,000-$150,000
The largest jump appears among the bigger cabins. Rabbu reports approximately $79,700 in average annual revenue for 5-bedroom properties and $150,500 for properties with six or more bedrooms.
The nightly-rate difference is just as notable. Five-bedroom properties average about $460 per night, while the 6+ bedroom group averages approximately $774. That gives larger cabins an opportunity to produce substantial annual revenue without needing every available night booked.
This is also why the broad $41,000-$42,000 Blue Ridge market average can undersell the opportunity for someone who owns a large property. The average is useful for understanding the overall market, but if you have a 5-, 6-, or 7-bedroom cabin designed for larger groups, your revenue potential is being driven by a different part of the market.
Why Can Larger Blue Ridge Cabins Make So Much More?
More bedrooms obviously create more sleeping capacity, but that isn't the whole explanation. A large cabin can serve an entirely different type of trip, and the economics change when a group that might otherwise need several accommodations can stay together in one property.
Larger Groups Can Support Higher Nightly Rates
Blue Ridge attracts groups that can include extended families, multigenerational travelers, several couples traveling together, reunions, and other leisure groups. For these guests, a $700 or $800 nightly rate can look very different when that cost is divided among 12, 14, or 16 people.
The Rabbu numbers show this difference clearly. Average daily rates rise from about $248 for 3-bedroom properties to $460 for 5-bedroom properties and $774 for the 6+ bedroom category.
That doesn't mean adding bedrooms automatically produces more revenue. The property still has to work for the number of people you're asking to stay there.
Guest Capacity Is About More Than the Number of Beds
If your cabin sleeps 16, guests need more than places to sleep. They need enough bathrooms, a kitchen that can handle the group, dining space, parking, and places to spend time together.
For a larger Blue Ridge cabin, look at whether the property can comfortably support its advertised capacity:
- Are there enough bathrooms for a full house?
- Can most or all of the group eat together?
- Is there enough refrigerator and kitchen capacity?
- Are there multiple indoor and outdoor gathering spaces?
- Can adults and children spread into different areas?
- Does the parking work when several families arrive separately?
- Do the amenities make sense for a large group?
A 5-bedroom cabin that technically sleeps 14 but becomes uncomfortable with 14 people isn't necessarily competing on equal terms with one designed around the full group experience. If you're trying to understand why one large cabin earns more than another, usable capacity is often more informative than bedroom count alone.
Does Location Affect Blue Ridge Cabin Rental Income?
Yes, although it isn't as simple as saying one Blue Ridge neighborhood always makes more money than another. Location changes the kind of experience you're selling, and different guests can place very different values on convenience, views, privacy, recreation, and water access.
Downtown Blue Ridge Appeals to Guests Who Want Convenience
A cabin close to downtown can offer easier access to restaurants, shopping, and the attractions around town. That can appeal to guests who want the mountain experience without spending every part of the trip at the property or driving long distances whenever they want to go out.
Aska Adventure Area Puts Outdoor Recreation Closer
The Aska Adventure Area offers a different proposition. Here, proximity to trails, outdoor recreation, and the mountain environment itself can become part of why guests choose the property.
Lake Blue Ridge and the Toccoa River Add a Water-Based Experience
Lake and river properties introduce another reason for a guest to choose one cabin over another. Water access, views, and recreation can become part of the stay rather than simply something guests drive elsewhere to experience.
Mountain Views, Privacy and Seclusion Can Be Part of the Product
For other cabins, the location advantage isn't proximity to anything. It's the ability to get away from everything.
Long-range mountain views, acreage, privacy, and a secluded setting can be central to how a cabin is marketed, particularly when the property has outdoor spaces designed to take advantage of them. Nearby communities including Mineral Bluff, Morganton, and Cherry Log can also compete for guests looking for this broader North Georgia cabin experience.
We wouldn't assign a fixed revenue premium to any of these locations without property-level evidence. The useful question is whether your location gives guests something they value enough to affect which property they choose and what they're willing to pay for the stay.
Which Amenities Can Help a Blue Ridge Cabin Earn More?
Amenities matter, but the first thing to understand is that some features help you compete while others simply keep you from falling behind. In a cabin market like Blue Ridge, there's an important difference between what guests expect to find and what actually gives them another reason to book your property.
A Hot Tub May Be Expected Rather Than a Differentiator
Rabbu reports that approximately 84% of the Blue Ridge Airbnb listings it tracks have a hot tub. BBQ grills appear on roughly 92% of listings and patios or balconies on about 86%.
A hot tub can still be important. In fact, not having one could make a cabin less appealing to guests comparing properties where they're common. But when most of your competitors already offer the same feature, adding one may be more about meeting the market than separating yourself from it.
Premium Cabins Need Reasons for Groups to Choose Them
Once the expected amenities are covered, the more interesting question is what makes a guest choose your cabin over another one with a similar bedroom count, location, and price.
Depending on the property, that could include:
- a pool or exceptional hot tub area;
- game and entertainment spaces;
- a theater room;
- sauna or wellness features;
- large outdoor gathering areas;
- fire pits and outdoor dining;
- pet-friendly features;
- exceptional mountain views;
- waterfront access; or
- amenities designed specifically for large groups.
Not every amenity will make financial sense for every cabin, and we wouldn't assume a specific revenue increase without evidence. A $100,000 improvement isn't worthwhile simply because it looks impressive in the listing. What matters is whether the improvement addresses something your target guests value and gives the property a stronger reason to win the reservation.
For a portfolio owner, this becomes a capital-allocation decision. You don't necessarily want to put the same amenity package into every Blue Ridge property. You want to identify which improvement gives each cabin the best opportunity to move toward the upper end of its realistic revenue range.
Does Design and Positioning Affect What Your Cabin Can Charge?
An expensive cabin isn't automatically a premium vacation rental. Guests encounter the property as a hospitality product, often first through a thumbnail, a nightly rate, and a handful of photos sitting beside competing properties on Airbnb or Vrbo.
That means the cabin needs to do more than contain expensive finishes. The design, photography, and listing need to communicate why the experience is worth the price.
For a premium Blue Ridge cabin, that includes things such as:
- interior design appropriate for the guest you're targeting;
- professional photography that communicates views, scale, and gathering spaces;
- clear bedroom and bathroom configurations;
- amenities that are easy to discover in the listing;
- outdoor spaces presented as a major part of the stay; and
- a clear reason for the guest to choose the property over similar cabins.
This is where real estate value and vacation rental value can diverge. Something that contributes significantly to the resale value of the home doesn't necessarily increase what a vacation rental guest is willing to pay per night. On the other hand, a relatively modest improvement in a gathering space, outdoor experience, or listing presentation can matter if it changes how guests perceive the stay.
By this point, we can explain a good portion of the roughly $30,000-to-$150,000 spread we see across different Blue Ridge cabin sizes. The property itself matters enormously: its capacity, setting, amenities, and how well it has been designed around the guests it's meant to serve.
But the property is only part of the revenue equation. Two very similar Blue Ridge cabins can still finish the year with very different revenue, which brings us to pricing, occupancy, seasonality, and how the property is actually operated.
What ADR and Occupancy Should You Expect in Blue Ridge?
Blue Ridge short-term rentals currently average about $353 per booked night and 48% occupancy, according to AirDNA. That works out to roughly $167 in RevPAR, which combines rate and occupancy to show how much revenue an available night is producing.
Those market averages are useful, but they don't mean your goal should be to charge $353 and fill 48% of your calendar. As we saw with cabin size, the economics change considerably as you move into larger properties. Your nightly rate, occupancy, and annual revenue need to make sense together.
Higher Occupancy Rates Don't Always Mean Higher Revenue
This is particularly important if you own a premium cabin. Rabbu's Blue Ridge data shows 1-bedroom properties averaging about 37% occupancy and $181 ADR, while 6+ bedroom properties average only about 29% occupancy but a $774 ADR. The larger properties nevertheless generate roughly $150,000 in average annual revenue compared with about $31,000 for the 1-bedroom group.
That tells you something important about how to evaluate your cabin: a fuller calendar isn't automatically a better-performing calendar. If you own a large property designed for groups, discounting aggressively to increase occupancy can work against you if you're giving up high-value nights that the property is capable of selling at a premium.
This doesn't mean you should simply raise rates and accept empty nights, either. You need enough occupancy to turn the property's pricing power into annual revenue. The goal is to find the combination of rate and bookings that produces the strongest revenue from the nights you make available.
Premium Cabins Can Make More With Fewer Booked Nights
This is one reason RevPAR becomes useful even if you don't spend much time thinking about hospitality metrics. It forces you to look at rate and occupancy together instead of celebrating either one in isolation.
If your occupancy is high but your nightly rates are substantially below comparable cabins, you may be leaving money on the table. If your rates look impressive but the property rarely books, the opposite problem may be occurring.
For a premium Blue Ridge cabin, the question isn't simply "How do we get more bookings?" It's whether you're capturing enough bookings at rates appropriate for the asset you own.
When Do Blue Ridge Cabins Make the Most Money?
Blue Ridge has meaningful year-round demand, but the revenue isn't evenly distributed across the calendar. Multiple datasets show two particularly important periods: summer and fall, with July and October repeatedly appearing among the strongest months.
That matters when you're looking at an annual revenue target. A cabin expected to generate $120,000 per year doesn't need to generate $10,000 every month. Some months and individual weekends can carry substantially more of the year's revenue than others.
Summer Is an Important Blue Ridge Revenue Period
June and July benefit from summer mountain travel and outdoor recreation. StaySTRA's monthly dataset shows occupancy increasing to about 58% in June and 64% in July, with July producing one of its highest monthly revenue figures. Rabbu likewise identifies July as a major Blue Ridge revenue period.
For larger cabins, summer can be particularly relevant because families and groups have more flexibility to travel together. If your property is built around a pool, outdoor gathering areas, lake or river access, or other group-oriented experiences, those features can also become more important to how the property competes during this period.
Fall Foliage Creates Another Major Peak
October consistently stands out in the Blue Ridge data. StaySTRA reports roughly 61% occupancy in October in one current dataset, with monthly revenue slightly higher than July. Other Blue Ridge market analyses similarly identify October and the fall foliage period as a major demand window.
For an owner, the important point isn't simply that October is busy. High-demand dates have more value than ordinary dates, so pricing and availability decisions during those periods can have an outsized effect on annual performance.
If you're blocking a premium fall weekend for personal use, accepting an unnecessarily low rate or applying a minimum-stay rule that makes the dates difficult to book, you're not losing an average night. You're potentially losing some of the most valuable inventory the property has all year.
Holidays Can Create High-Value Booking Windows
The holiday period deserves similar attention. While the exact monthly revenue figures vary considerably between data providers because their samples and methodologies differ, December appears as another strong period in several datasets, particularly around holiday travel.
That can favor larger cabins because Thanksgiving, Christmas, and New Year's travel often involves families and multigenerational groups—the same demand segment that larger Blue Ridge properties are particularly well suited to accommodate.
Slower Months Require a Different Strategy
January and February are consistently among the softer periods in the monthly data we reviewed. StaySTRA, for example, shows January occupancy around 33% and February revenue among the lowest of the year in one dataset.
That doesn't necessarily mean you should chase peak-season occupancy during February by cutting rates until the calendar fills. A better strategy may involve adjusting rates, minimum stays, and promotions while recognizing that the underlying demand environment is different.
This is why annual revenue management is not simply about choosing one nightly rate. The value of a Blue Ridge cabin changes with the calendar.
What Can Keep a Blue Ridge Cabin From Reaching $80K–$150K?
If you own a larger cabin, the revenue figures from Part 1 can create an obvious follow-up question: if properties in my size category are producing $80,000 to $150,000, what could keep mine from getting there?
Sometimes the answer is the property itself. A 6-bedroom cabin without the bathrooms, common areas, views or amenities expected of a premium group property may not compete with the strongest 6-bedroom cabins in the market. But when the physical asset is strong, the gap increasingly comes down to how much demand you're reaching and how effectively you're converting that demand into valuable bookings.
Too Many Unavailable Nights Put a Ceiling on Revenue
Your cabin can't generate rental revenue on nights you don't make available. This sounds obvious, but it matters when comparing your property with market revenue benchmarks.
AirDNA reports that about 74.9% of Blue Ridge listings are available between 271 and 365 nights per year. That means most of the market's inventory is available for a substantial portion of the calendar.
If you use your cabin personally for several weeks each year, there is nothing inherently wrong with that. You bought the property, and enjoyment may be part of your return. But when evaluating performance, you should distinguish between revenue the property failed to capture and revenue it never had the opportunity to capture because the dates weren't available.
This becomes particularly important if owner blocks overlap with July, October, holidays or other high-demand periods.
Minimum-Stay Rules Can Help or Hurt
AirDNA reports that about 69% of Blue Ridge listings use a 2-night minimum stay, while another 17.8% use three nights. Longer minimums represent a much smaller portion of the market.
That doesn't mean two nights is automatically the correct policy for your property. A premium holiday weekend may justify a longer stay, while another period may require more flexibility.
The problem comes when minimum stays are treated as a permanent rule rather than part of inventory management. A rigid four-night minimum, for example, can make a three-night opening between existing reservations impossible to sell. Conversely, accepting a short reservation across a valuable holiday period could prevent a more profitable longer booking.
For larger cabins, minimum-stay strategy should change with demand rather than remain static throughout the year.
Pricing Too Low Can Be Just as Expensive as Pricing Too High
Overpricing is easy to recognize when the calendar stays empty. Underpricing can be harder to spot because the result looks successful: the cabin books.
If your best October weekends fill months ahead at rates well below comparable properties, high occupancy can hide the fact that those nights may have sold for more. The same problem can occur around holidays and high-demand summer weekends.
On the other hand, setting rates based on what you want the property to earn rather than what guests will pay can leave too much inventory unsold. Good pricing requires continual adjustment based on season, day of week, booking pace, remaining availability, and the performance of comparable cabins.
Weak Presentation Can Limit What Guests Are Willing to Pay
Part 1 covered the importance of design and amenities, but even a strong property can underperform if guests don't understand what makes it special.
Photography, listing order, headlines, descriptions and amenity information influence how the cabin competes when a guest has several similar properties open in different browser tabs. For a large property, the listing should make it easy to understand not only how many people can sleep there, but what those people will actually do together once they arrive.
A game room hidden in photo 47, a spectacular view that isn't visible in the first few images or an outdoor space that looks much smaller than it actually is can weaken the perceived value of an otherwise excellent asset.
Distribution Determines How Much Demand You Can Reach
Blue Ridge is also heavily cross-listed. AirDNA reports that approximately 73.8% of current Blue Ridge inventory appears across multiple booking channels, compared with 18.4% that is Airbnb-only and 7.8% that is Vrbo-only.
That doesn't mean every cabin needs to appear everywhere. It does show that a premium property competing only for demand on one channel may be operating differently from much of its market.
Airbnb and Vrbo are important, but distribution can also include other OTAs and direct bookings. For a portfolio owner, the question is whether each property is reaching the guest segments most likely to book it rather than simply whether the Airbnb listing is active.
Is $100K–$150K in Blue Ridge Cabin Revenue Actually Profitable?
This is where gross revenue can become misleading for a different reason. A cabin generating $150,000 per year sounds better than one generating $100,000, but revenue tells you what the rental operation produced, not what the owner kept or what the investment returned.
AirDNA's annual revenue metric represents rental earnings before host expenses. It includes booked nightly rates and applicable guest fees, which means the figure should not be read as owner profit.
| Revenue can tell you | Revenue alone doesn't tell you |
|---|---|
| How much the rental operation generated | Net operating income |
| The property's ability to attract paid stays | Acquisition basis |
| What guests paid for booked inventory | Financing costs |
| How strongly the property monetizes demand | Taxes and insurance |
| Top-line rental performance | Maintenance and capital expenditures |
| How one property compares at the revenue level | Return on invested capital |
Gross rental revenue measures top-line performance. It should be evaluated alongside operating costs, capital requirements and investment returns.
A larger cabin can also cost substantially more to operate. More bedrooms can mean more furnishings, linens, utilities and maintenance. Pools, hot tubs, theaters, game rooms, and extensive outdoor spaces may help a property compete, but they also have operating and replacement costs.
That's why an investor should eventually move from "How much can this cabin make?" to "What does this cabin make relative to what I have invested in it?"
A $100,000 cabin acquired at the right basis and operated efficiently could be a stronger investment than a $150,000 cabin carrying substantially more acquisition cost, debt, and ongoing expense. For a portfolio owner, gross revenue is an important performance metric, but it isn't the final one.
How Do You Know If Your Blue Ridge Cabin Is Underperforming?
This is where the broad Blue Ridge averages become less useful again.
Suppose your cabin generated $95,000 last year. Compared with AirDNA's roughly $42,400 market average, that looks excellent. But if you own a premium 6-bedroom property sleeping 18 with exceptional views and a strong amenity package, the more relevant question is how that $95,000 compares with similar properties.
AirDNA uses this same basic approach in its property-performance tools, allowing individual listings to be compared with a comp set using measures such as revenue, ADR, occupancy, booking lead time, and review score.
Compare Your Cabin With Properties Guests Would Actually Consider
A useful Blue Ridge comp set should account for characteristics such as:
- bedroom and bathroom count;
- realistic guest capacity;
- location;
- mountain, lake or river setting;
- views and privacy;
- property quality;
- amenities;
- availability;
- ratings and reviews; and
- the type of guest the property is designed to attract.
The simplest way to think about this is from the guest's perspective:
A useful way to define your comp set
If your cabin disappeared from the search results, which properties would your ideal guest seriously consider booking instead?
Those are the cabins that can tell you much more about whether you're underperforming than the market-wide average.
Look for the Gap, Then Figure Out What Is Causing It
Once you have a reasonable benchmark, you can compare what the cabin actually produces with what similar properties demonstrate may be achievable.
If there's a meaningful gap, don't immediately assume the answer is lower pricing or a new amenity. The problem could sit in several places:
- Asset: capacity, bathrooms, amenities, condition, or outdoor experience.
- Positioning: design, photography, merchandising, or target guest.
- Pricing: ADR, discounts, weekend premiums, or seasonal strategy.
- Availability: owner blocks, minimum stays, or calendar restrictions.
- Distribution: insufficient exposure to relevant demand.
- Operations: reviews, maintenance, guest experience, or execution.
That diagnosis matters because each problem requires a different investment. Spending $50,000 on another amenity won't fix a pricing problem, and changing pricing won't fix a property that doesn't comfortably accommodate the number of guests it claims to sleep.
What Should Each Blue Ridge Cabin in Your Portfolio Be Making?
If you own multiple vacation rentals, the biggest mistake would be to take the $42,000 Blue Ridge average—or even the $150,000 large-cabin figure—and turn it into a portfolio-wide target.
Each asset needs its own reasonable performance range.
A 3-bedroom cabin generating $60,000 may be substantially outperforming its property class, while a 6-bedroom cabin generating $100,000 could have considerably more upside. Looking only at absolute revenue could lead you to spend money improving the wrong property.
A better portfolio view looks something like this:
| 🏡 Property | 🎯 Reasonable benchmark | 📊 Actual performance | 🔎 What to investigate |
|---|---|---|---|
| Cabin A | Based on its own property class and comps | Above / at / below | 🛡️ Protect what's working |
| Cabin B | Based on its own property class and comps | Above / at / below | 💵 Pricing or positioning |
| Cabin C | Based on its own property class and comps | Above / at / below | 🛠️ Asset or amenity gap |
| Cabin D | Based on its own property class and comps | Above / at / below | ⚙️ Availability or operations |
💡 Portfolio takeaway: The goal is not to give every cabin the same revenue target. Benchmark each asset against its own property class and competitive set, then investigate the source of any performance gap.
That gives you a much better basis for deciding where to deploy capital. One property may need an amenity investment, another may need a complete repositioning, and another may already have the right physical product but need better pricing and revenue management.
It also changes how you evaluate your property manager. Instead of asking only whether portfolio revenue increased, you can ask whether each asset is moving closer to the performance its competitive position suggests it should be capable of achieving.
So, How Much Should Your Blue Ridge Cabin Make?
The broad answer remains straightforward: AirDNA currently puts average Blue Ridge short-term rental revenue at about $42,400 per year, while Rabbu reports roughly $41,400. Larger properties occupy a very different part of the market, with Rabbu showing approximately $80,000 for 5-bedroom cabins and $150,000 for properties with six or more bedrooms.
Where your cabin should fall within that spectrum depends on what you own. Size and usable guest capacity matter, but so do location, views, amenities, design, and how well the property serves the type of guest you're targeting. From there, pricing, availability, seasonality, distribution, and day-to-day operation determine how much of that potential you actually capture.
For a portfolio owner, that's ultimately the more useful way to think about Blue Ridge rental income. Don't ask every property to beat the same market average. Establish what each asset should reasonably be capable of producing, measure the gap between that potential and its actual performance, and then decide whether closing that gap requires changes to the property, its positioning, or its management.
That is also the point where evaluating Blue Ridge vacation rental management becomes more useful than simply comparing management fees: the question is whether the operating strategy is helping the asset perform closer to its potential.
Frequently Asked Questions About Blue Ridge Cabin Rental Income
How much do Blue Ridge cabin rentals make per month?
Blue Ridge cabins average roughly $3,400–$3,500 per month when annual market revenue is simply divided by 12, based on the roughly $41,000–$42,000 annual averages reported by Rabbu and AirDNA. But you shouldn't expect your actual monthly revenue to look anything like a flat $3,500 every month.
Blue Ridge is seasonal, with stronger revenue periods around summer, fall foliage season and certain holidays, while January and February tend to be softer. Larger cabins can also operate well above the market average: a property producing $120,000 annually, for example, mathematically averages $10,000 per month, but its actual revenue may still be concentrated heavily in its strongest demand periods.
For an owner, the more useful approach is to forecast revenue month by month rather than dividing an annual target by 12. That lets you evaluate whether a slow February is actually underperforming and whether you're capturing enough revenue during high-value summer, fall and holiday dates.
Can a Blue Ridge cabin make $100,000 a year?
Yes. A Blue Ridge cabin can generate more than $100,000 in annual gross rental revenue, particularly among larger properties. Rabbu's current Blue Ridge data shows 5-bedroom cabins averaging roughly $80,000 annually and properties with six or more bedrooms averaging about $150,000.
That doesn't mean every large cabin should make $100,000. Revenue still depends on the property's guest capacity, location, views, amenities, quality, availability, nightly rates and how effectively it is operated. A six-bedroom property that sleeps 12 awkwardly is also a different rental product from one intentionally designed to accommodate 16 or 18 guests.
If you're trying to determine whether your cabin can cross $100,000, compare it with similar large properties rather than the roughly $41,000–$42,000 Blue Ridge market average. Then look for the gap between what comparable cabins produce and what your property currently earns.
What size cabin makes the most money in Blue Ridge, GA?
The largest cabins currently generate the highest average annual revenue in Rabbu's Blue Ridge data. Properties with six or more bedrooms average approximately $150,000 annually, compared with roughly $80,000 for 5-bedroom cabins, $57,000 for 4-bedroom cabins and $40,000 for 3-bedroom properties.
The reason isn't simply that more bedrooms equal more money. Larger cabins can accommodate bigger groups, and those groups can support substantially higher nightly rates. Rabbu's data shows average daily rates rising from about $248 for 3-bedroom cabins to approximately $774 for properties with six or more bedrooms.
If you're evaluating an acquisition, however, highest revenue shouldn't automatically mean best investment. A larger property may cost substantially more to acquire, furnish, maintain and operate. Compare the additional revenue opportunity with acquisition basis, operating expenses, financing, capital requirements and expected return before deciding which cabin size makes the most sense for your portfolio.
What is a good occupancy rate for a Blue Ridge cabin?
There isn't one occupancy rate that defines a successful Blue Ridge cabin. AirDNA reports roughly 48% occupancy for the overall Blue Ridge short-term rental market, but Rabbu's property-size data shows why occupancy needs to be evaluated alongside nightly rate and annual revenue.
For example, Rabbu's 6+ bedroom properties average only about 29% occupancy, yet their roughly $774 ADR helps them generate approximately $150,000 in average annual revenue. Smaller 1-bedroom properties show higher occupancy at about 37% in the same dataset but generate only around $31,000 annually.
So don't judge your cabin by occupancy alone. Look at occupancy, ADR and the revenue generated from your available nights together. If your calendar is extremely full because you're consistently priced below comparable properties, increasing occupancy may actually be hiding an opportunity to earn more.
Are Blue Ridge cabins a good investment?
A Blue Ridge cabin can be a good investment, but strong rental revenue alone doesn't establish that it is one. The market clearly supports meaningful vacation rental demand, and current data shows larger cabins capable of generating substantially more than the overall market average. Whether that translates into a good investment depends on what you paid for the property and what it costs to own and operate.
For an investor, that means looking beyond gross rental revenue to acquisition cost, financing, insurance, property taxes, utilities, management, maintenance, cleaning economics, amenity upkeep, and future capital expenditures. From there, you can evaluate NOI, cash flow and return on the capital invested.
If you're comparing multiple Blue Ridge opportunities, don't simply buy the cabin with the highest projected revenue. Look for the asset where the relationship between acquisition cost, realistic revenue potential, operating costs and opportunities for improvement creates the strongest investment case.
Share to social media
More posts